Instructions for Side by Side Printing
- Print the notecards
- Fold each page in half along the solid vertical line
- Cut out the notecards by cutting along each horizontal dotted line
- Optional: Glue, tape or staple the ends of each notecard together
MBA521 Exam 1 Study Guide
front 1 Which is a characteristic of the mean as a measure of center? | back 1 d) It utilizes all the information in a sample |
front 2 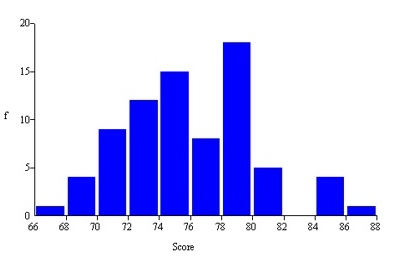 This histogram shows Chris's golf scores in his last 77 rounds at Devil's Ridge. Which is not a correct statement? a) About 15 percent of his scores are in the interval
74<76 | back 2 b) The number of bins is consistent with Sturges' Rule Explanation |
front 3 Which is the Excel formula for the standard deviation of a sample array named Data? a) =STDEV.S(Data) | back 3 a) =STDEV.S(Data) Explanation |
front 4 A line chart would not be suitable to display which data? a) Exxon-Mobil's quarterly sales data for the last five
years | back 4 b) Annual compensation of the top 50 CEOs Explanation |
front 5 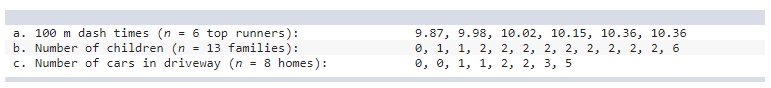 a) Find the mean, median, and mode for each data set. | back 5 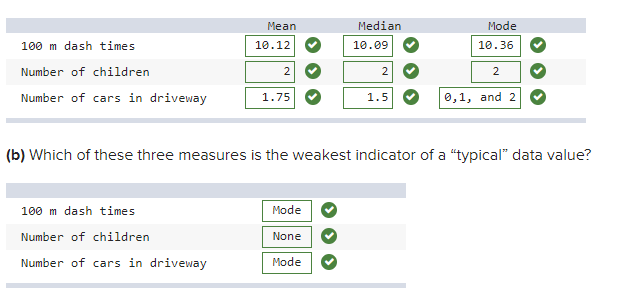
(a)
|
front 6 Which type of data (cross-sectional or time series) is each variable? a) Mexico's GDP for each of the last 10 quarters. | back 6 a) Time series |
front 7 The target population is all stocks in the S&P 500 index. Is each of the following a parameter or a statistic? a) The average price/earnings ratio for all 500 stocks in the
S&P index. | back 7 Explanation
(a) Parameter. The S&P is the population. |
front 8 Would you use a sample or a census to measure each of the following? a) The number of cans of Campbell's soup on your local supermarket's
shelf today at 6:00 p.m. | back 8 Explanation
(a) Census. It would be easy enough to count all of
them. |
front 9 For each data set, is the mode a good measure of center? a) Genders of 12 CEOs: M, M, F, M, F, M, M, M, F, M, M, M | back 9 Explanation a. Yes |
front 10 A certain health maintenance organization (HMO) is studying its daily office routine. It collects information on three variables: the number of patients who visit during a day, the patient’s complaint, and the waiting time until each patient sees a doctor. a) Which variable is categorical? | back 10 a) The patient's complaint |
front 11 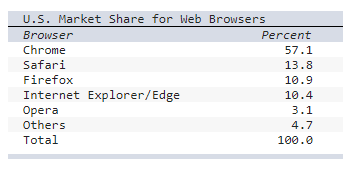 Consider the following table of data. a) Select the correct chart to display the above data - Yes, a bar chart or column chart would also work. | back 11 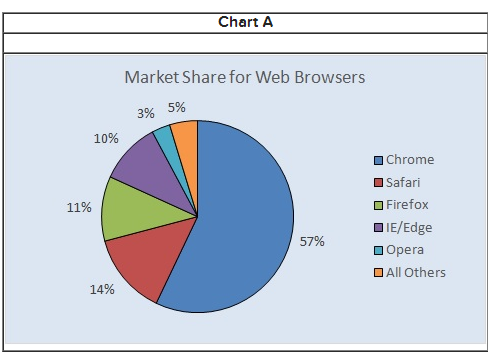 a) Chart A |
front 12 One disadvantage of the range is that a) it is expressed in different units than the mean. | back 12 d) only extreme values are used in its calculation. Explanation |
front 13 Noodles and Company tested consumer reaction to two spaghetti Sauces.
Each of 70 raters assessed both Sauces on a scale of 1 (worst) to 10
(best) using several taste criteria. To correct for possible bias in
tasting order, half the raters tasted Sauce A first, while the other
half tasted Sauce B first. Actual results are shown below for “overall
liking.” a) Calculate the mean and standard deviation for each
sample. | back 13 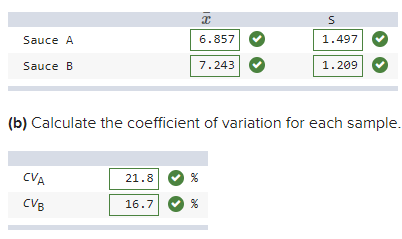 c) On average, consumers seem to prefer Sauce B over Sauce A. Explanation
(a)
|
front 14 Which distribution is least likely to be skewed to the right by high values? a) Annual incomes of n passengers on a flight from New York
to London | back 14 c) Cost of a plain McDonald’s hamburger in n U.S. cities Explanation |
front 15 Consider the following sample data: Sample A: 6, 7, 8 | back 15 a) Sample A: Sample B: Sample C: b) The idea is to illustrate that the standard deviation is not a function of the value of the mean. Explanation |
front 16 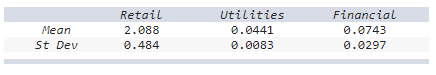 The asset turnover ratio (ATR) is the ratio of a company’s revenues to the value of its assets (indicating its efficiency in deploying its assets). We should not use the standard deviation to compare ATR variation among industrial sectors because firms with large asset bases (e.g., utilities, financial) typically have lower mean ATR than, say, retail firms. a) Use the sample data to calculate the coefficient of variation for
each sector. (Round your answers to 2 decimal places.)
| back 16 Explanation |
front 17 Which survey questions below would be suitable for a set of check boxes providing choices for the respondent to choose from? (You may select more than one answer. Click the box with a check mark for the correct answer and double click to empty the box for the wrong answer.)
Check All That Apply a) How concerned are you for the environment? | back 17 a) How concerned are you for the environment? c) What is your salary range? |
front 18 What type of data (categorical, discrete numerical, or continuous numerical) is each of the following variables? a) The manufacturer of your car. | back 18 a) Categorical |
front 19 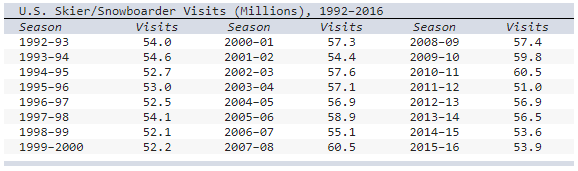 The table shows the number of visits to Skier/Snowboarder from 1992 to 2016 in US. a) Select the line chart of the Skier/snowboarder data. | back 19 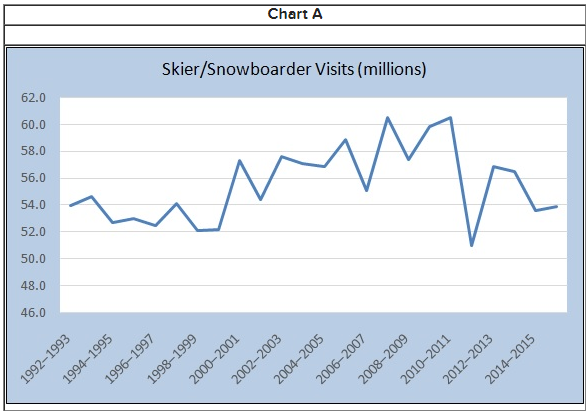 a) Chart A Explanation |
front 20 For each data set, find the mean, median, and mode. a) Campus health center visits (12 students): 0, 0, 0, 0, 0, 1, 2,
3, 3, 5, 5, 15 (Round your answers to 2 decimal places.) c) Sodium grams in canned soup (8 varieties): 225, 255, 295, 302, 304, 337, 351, 366 (Round your answers to 2 decimal places.) | back 20 Explanation |
front 21 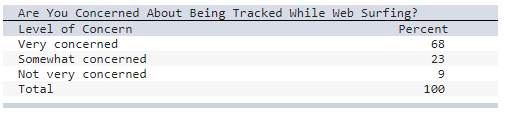 a) Select the correct 2-D pie chart for these web-surfing
data. | back 21 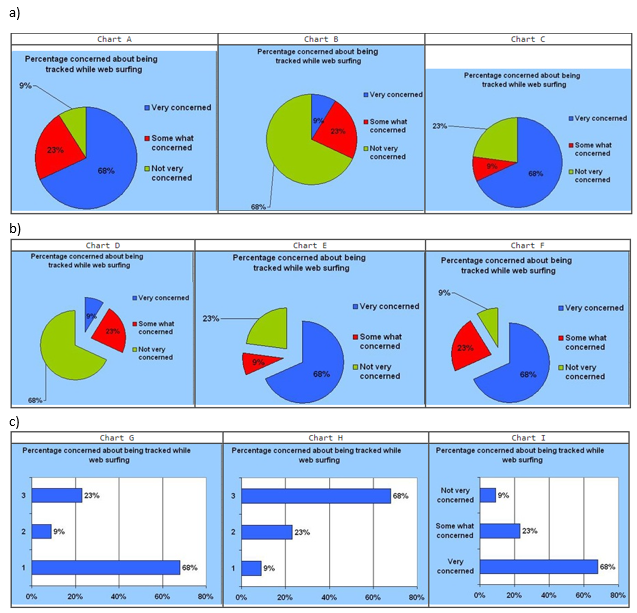 a) Chart A |
front 22 As a measure of variability, compared to the range, an advantage of the standard deviation is that it: a) describes the distance between the highest and lowest
values. | back 22 b) considers all data values. Explanation |
front 23 Five homes were recently sold in Oxnard Acres. Four of the homes sold for $400,000, while the fifth home sold for $2.5 million. Which measure of central tendency best represents a typical home price in Oxnard Acres? a) The midrange or mean. | back 23 c) The median or mode. Explanation |
front 24 What type of data (categorical, discrete numerical, or continuous numerical) is each of the following variables? a) Length of a TV commercial. | back 24 a) Continuous Numerical |
front 25 Analysis of portfolio returns over a 20-year period shows the statistics below. a) Calculate and compare the coefficients of variation.
(Round your answers to 2 decimal places.)
| back 25 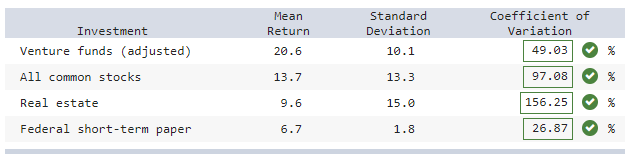 Explanation |
front 26 Would you use a sample or census to measure each of the following?
| back 26 Explanation |
front 27 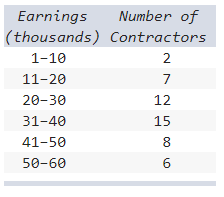 Below is a frequency distribution of earnings of 50 contractors in a country. Regarding this distribution, which of the following is correct? a) The frequency distribution contains too many class
intervals. | back 27 c) The class interval limits are ambiguous. Explanation |
front 28  Days on the market are shown for the 36 most recent home sales in the city of Sonando Hills. a) Calculate the mean, median, and mode. (Round your answers
to 2 decimal places.) | back 28 a) Mean = 98.53 |
front 29 Is each of the following a parameter or statistic? a) The number of visits to a pediatrician’s office last
week. | back 29 Explanation
(a) Statistic. The week of visits is the sample. |
front 30 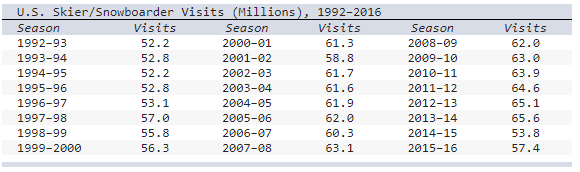 The table shows the number of visits to Skier/Snowboarder from 1992 to 2016 in US.
a) Select the line chart of the skier/snowboarder data. | back 30 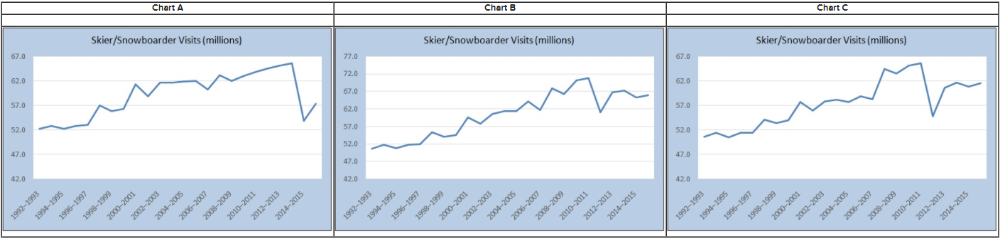 Explanation |
front 31 Identify the following data as either time series or cross-sectional.
| back 31 Explanation
(a) Cross-sectional. A single point in time: end of 2017. |
front 32 Three randomly chosen Colorado students were asked how many times they went rock climbing last month. Their replies were 5, 6, 7. The standard deviation is a) 1.212 | back 32 b) 1.000 |
front 33 The contingency table below summarizes a survey of 1,000 bottled beverage consumers. Find the following probabilities or percentages: | back 33 Explanation
(a)
|
front 34 “The probability of rolling three sevens in a row with dice is
.0046.” a) Empirical | back 34 b) Classical |
front 35 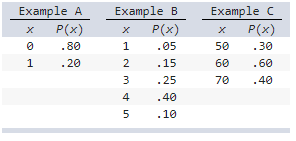 Which of the following could not be probability distributions? a) None | back 35 c) Examples B and C Explanation Example A is a probability distribution because the sum of
P(x) is 1 (.8 + .2 = 1) and all probabilities are
nonnegative. |
front 36 Last year’s freshman class at Big State University totaled 5,331 students. Of those, 1,268 received a merit scholarship to help offset tuition costs their freshman year (although the amount varied per student). The amount a student received was N($3,446, $475). If the cost of full tuition was $4,300 last year, what percentage of students who received a merit scholarship did not receive enough to cover full tuition? (Round your answer to the nearest whole percent.) | back 36 Percentage of Students = 96% Explanation Find P(X < $4,300) =
P(Z<4,300−3,446475)=P(Z<1.80)P(Z<4,300-3,446475)=P(Z<1.80)
=NORM.S.DIST(1.80,1) = 0.9641. 96% of merit scholarship students will
not receive enough to cover their full tuition. |
front 37 Pepsi and Mountain Dew products sponsored a contest giving away a
Lamborghini sports car worth $288,000. The probability of winning from
a single bottle purchase was .00000510. | back 37 Expected Value = $1.4688 Explanation X is the amount of the “value” of a bottle. X can be either $288,000, the value of the Lamborghini, or $0. To find the expected value multiply each value of X by the associated probability. E(X) = ($288,000)(.00000510) + ($0)(.99999490) = 1.4688. |
front 38 Student Life Insurance Company wants to offer an insurance plan with a maximum claim amount of $6,700 for dorm students to cover theft of certain items. Past experience suggests that the probability of a maximum claim is .02. What premium should be charged if the company wants to make a profit of $36 per policy? Assume any student who files a claim files for the maximum amount and there is no deductible. | back 38 Premium Amount = $170 Explanation X is the amount of the claim. Assume a student who files a claim will claim the maximum amount of $6,700. The values of X are either $6,700 or $0. Expected payout = E(X) = $6,700(.02) + ($0)(.98) = $134, so company adds $36 and charges $170. |
front 39 The cabin of a business jet has a cabin height 5 feet 9 inches
high. | back 39 Probability = .6443 Explanation We want to know the probability of getting a business traveler who
is taller than 5’ 9”. To make it easier, we can convert everything to
inches. Therefore, we should use a mean of 70 inches and a cabin
height of 69 inches. |
front 40 Use Excel to find each probability. (Round your answers to 4 decimal places.) a) P(80 < X < 110) for
N(100,15) | back 40 Explanation a. |
front 41 The host of a daily financial radio program stated that in his
opinion, “There is a 25 percent chance that AT&T Wireless and
Verizon will merge.” a) Empirical | back 41 b) Subjective |
front 42 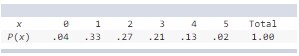 On the midnight shift, the number of patients with head trauma in an emergency room has the probability distribution shown below. a) Calculate the mean and standard deviation. (Round your mean value to 2 decimal places and standard deviation to 3 decimal places.) b) Describe the shape of this distribution. | back 42 Explanation
(a)
|
front 43 Daily output of Marathon's Garyville, Lousiana, refinery is normally distributed with a mean of 232,000 barrels of crude oil per day with a standard deviation of 7,000 barrels. a) What is the probability of producing at least 232,000 barrels?
(Round your answer to 4 decimal places.)
| back 43 Explanation
(a)
z =232,000 − 232,000 = 0.7,000
z =239,000 − 232,000 = 1and z =232,000 − 232,000 =
0.7,0007,000P(232,000 < X < 239,000) =
P(0 < Z < 1), which is .3413 (from Appendix C-1).
z =239,000 − 232,000 = 1.7,000P(Z < 1) =
.8413 (from Appendix C-2).
z =245,000 − 232,000 = 1.86.7,000P(Z <
1.86) = .9686 (from Appendix C-2).
z =225,000 − 232,000 = −1.7,000 |
front 44 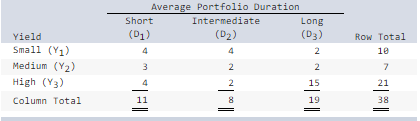 The following contingency table shows average yield (rows) and average duration (columns) for 38 bond funds. For a randomly chosen bond fund, find the probability of the following: (Round your answers to 4 decimal places.) a) The bond fund is of long duration. | back 44 Explanation a. P(D
3) = 19/38 = 0.5000. |
front 45 If Punxsutawney Phil sees his shadow on February 2, then legend says
that winter will last 6 more weeks. In 123 years, Phil has seen his
shadow 103 times. b) What kind of probability is this? | back 45 Explanation a) b) |
front 46 The contingency table below shows the results of a survey of video viewing habits by age. a) Probability that a viewer is aged 18–34.
(Round your answer to 2 decimal places.)
| back 46  Explanation
(a)
|
front 47 Suppose X ~ N(58, 7). Write the Excel function to calculate the following probabilities: a) P(X<55.1) | back 47 a) =NORM.DIST(55.1,58,7,1) |
front 48 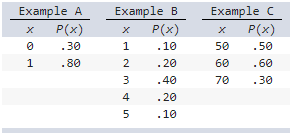 Which of the following could not be probability distributions? a) Example B and C | back 48 c) Example A and C Explanation Example B is a probability distribution because the sum of
P(x) is 1 (.1 + .2 + .4 + .2 + .1 1) and all
probabilities are nonnegative. |
front 49 Oxnard Petro Ltd. is buying hurricane insurance for its off-coast oil
drilling platform. During the next five years, the probability of
total loss of only the above-water superstructure ($220 million) is
.30, the probability of total loss of the facility ($920 million) is
.30, and the probability of no loss is .40. | back 49 Expected Loss = $342 million Explanation Let X equal the loss during a hurricane. The values of X are either $220 million, $920 million, or $0. Expected Loss = E(X ) = $220(.30) + $920(.30) + $0(.40) = $342 million. |
front 50 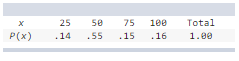 On hot, sunny, summer days, Jane rents inner tubes by the river that runs through her town. Based on her past experience, she has assigned the following probability distribution to the number of tubes she will rent on a randomly selected day. a) Calculate the expected value and standard deviation of this
random variable X. | back 50 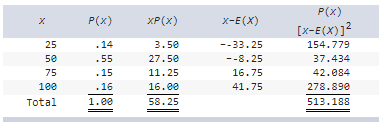 Explanation
(a)
|
front 51 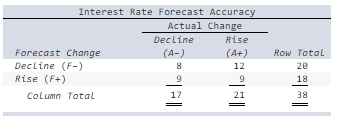 Researchers examined forecasters’ interest rate predictions for 34 quarters to see whether the predictions corresponded to what actually happened. The 2 × 2 contingency table below shows the frequencies of actual and predicted interest rate movements. Calculate each probability (i–vi): (Round your answers to 4 decimal places.) | back 51 Explanation |
front 52 If the weight (in grams) of cereal in a box of Lucky Charms is N(487,7), what is the probability that the box will contain less than the advertised weight of 457 g? Note: You may need to use Excel to calculate the exact probabilities. (Round your answer to 5 decimal places.) | back 52 Probability = .00001 Explanation P(X < 457) = P(Z < 457 − 4877) = P(Z<−4.29) = .00001.P(X < 457) = P(Z < 457 − 4877) = P(Z<-4.29) = .00001. |